28 Jun 2026
How Regional Transit Expansions Correlate With Visitor Patterns at Border-Area Gaming Facilities
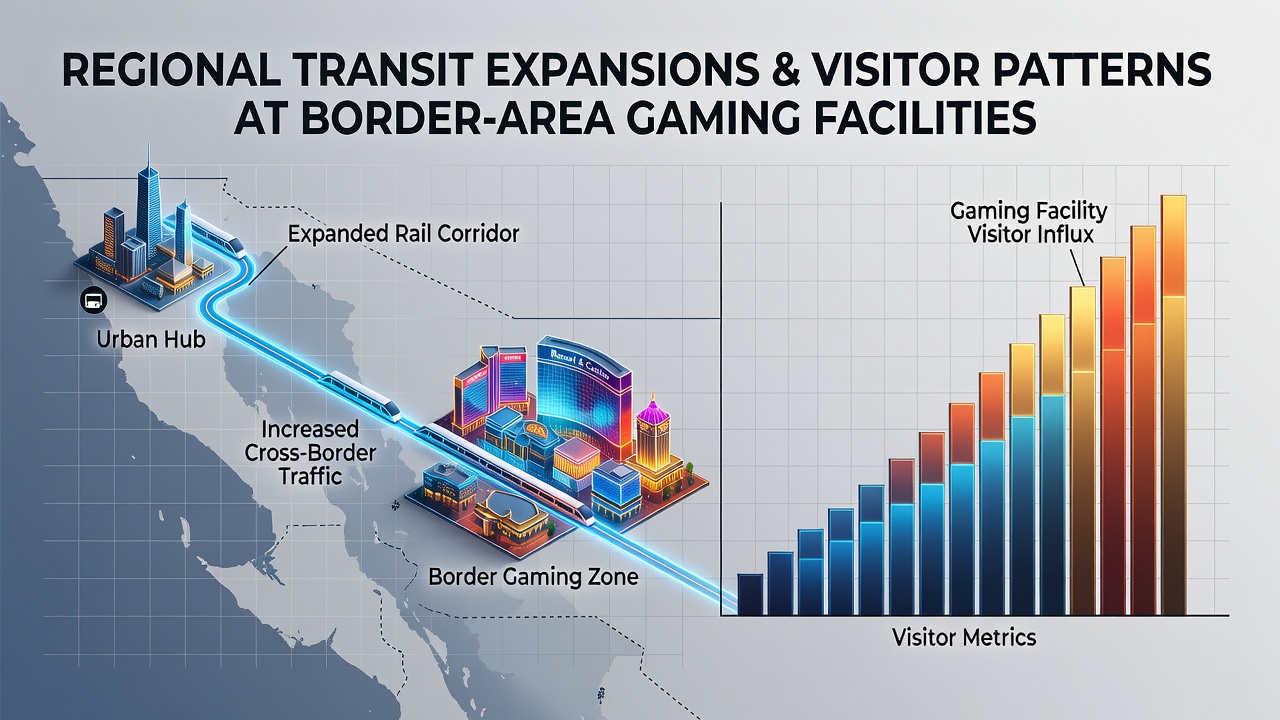
Regional transit expansions often reshape visitor flows at gaming facilities located near international borders, and data from multiple jurisdictions shows measurable shifts in attendance tied to improved rail, bus, and highway networks. Observers note that when new lines or upgraded routes reduce travel times across state or national lines, facilities experience changes in daily and weekend visitor counts that align with those infrastructure improvements.
Transit Infrastructure and Accessibility Shifts
Border-area casinos depend on cross-regional movement, and expansions in public transit create direct pathways that previously required private vehicles or longer transfers. Studies from transportation departments in North America indicate that light-rail extensions and international bus corridors frequently coincide with increased arrivals during evening and overnight hours when gaming peaks occur. Those who've examined ridership logs alongside facility entry records find that stations placed within two miles of casino properties tend to register higher disembarkation rates on days when events or promotions run at the venues.
What's interesting is how these patterns differ by border type, with US-Canada crossings showing steadier growth compared to US-Mexico routes where seasonal factors also influence outcomes. Researchers discovered that dedicated shuttle services linking transit hubs to gaming sites amplify the effect, producing visitor increases that outpace locations relying solely on general public routes.
Documented Correlations in Multiple Regions
According to figures compiled by regional planning agencies, one expansion project along the Niagara Frontier added service frequency and produced a documented rise in cross-border day trips that matched gaming facility reports of elevated table and slot activity. Similar outcomes appeared in the Pacific Northwest where improved Amtrak connections and regional bus networks fed into facilities near the Canadian line, and analysts recorded consistent weekend surges once schedules aligned with typical visitor departure times from major cities.
Take one analysis conducted near the Arizona-Sonora border where highway widening and new park-and-ride lots were completed, and subsequent traffic counts showed elevated volumes heading toward gaming destinations during late afternoons. Those patterns held even when fuel prices fluctuated, suggesting that transit reliability played a larger role than previously assumed in traveler decisions.
Data Patterns Emerging in 2026
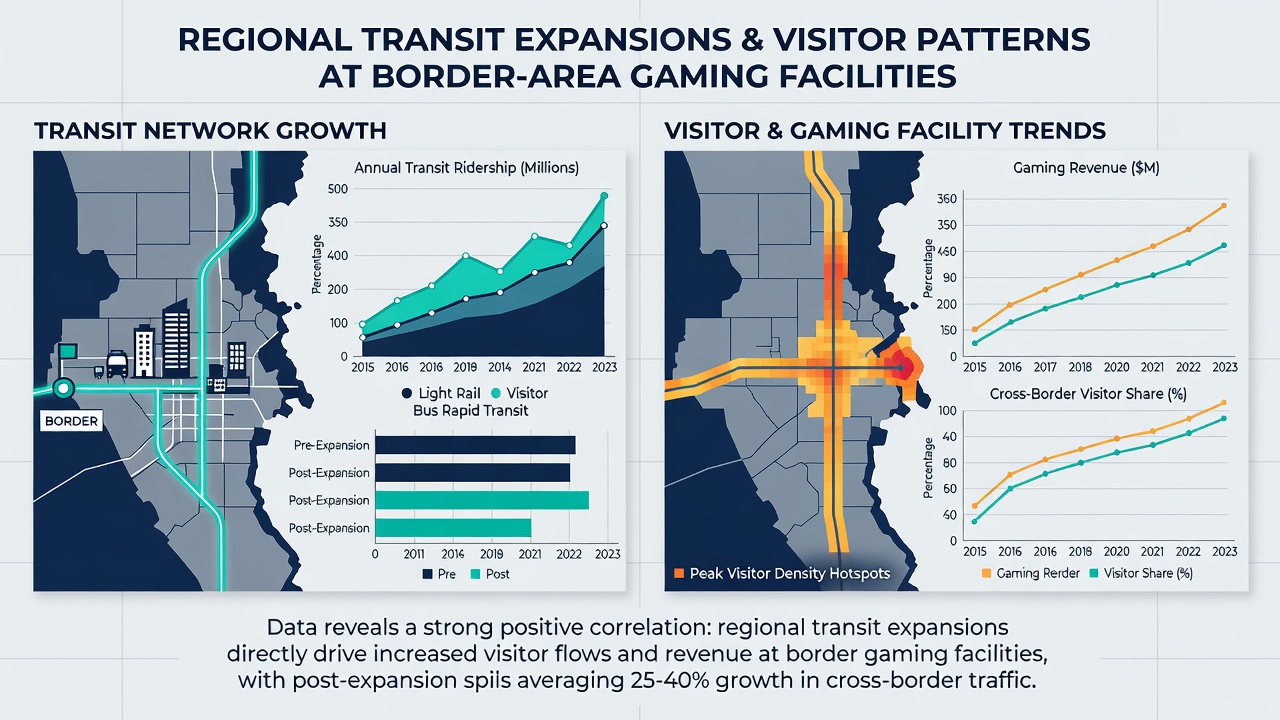
June 2026 marks several scheduled transit openings that border facilities are already preparing to monitor, including frequency increases on existing cross-border services and new feeder routes designed to connect suburban populations with gaming clusters. Preliminary modeling from transportation researchers suggests these changes could redistribute visitor origins, pulling more participants from previously distant metro areas while potentially reducing reliance on drive-up traffic from immediate border communities.
Evidence from earlier expansions shows that facilities positioned to capture both commuter and leisure riders see the strongest alignment between ridership growth and gaming revenue reports, whereas isolated sites experience more modest or delayed effects. Industry associations tracking these metrics have noted that integrated ticketing systems between transit operators and casino loyalty programs further strengthen the observed correlations by simplifying the journey for repeat visitors.
Measurement Approaches and Variables
Quantifying the relationship requires combining transit ridership statistics with anonymized facility entry data, and multiple studies have applied time-series analysis to isolate transit effects from marketing campaigns or economic conditions. Variables such as border wait times, fare integration, and station proximity all appear in regression models that transportation economists use to predict future visitor distributions.
One case near the Great Lakes region revealed that a new express bus route reduced average travel duration by 35 minutes and corresponded with a measurable uptick in mid-week attendance at two nearby properties. Observers tracking similar projects emphasize that parking availability at transit stations and safety perceptions along routes also influence whether riders choose these options over personal vehicles.
Conclusion
Regional transit expansions continue to intersect with visitor patterns at border-area gaming facilities through measurable improvements in accessibility and timing. Data collected across North American jurisdictions demonstrates that proximity to new or enhanced routes often aligns with shifts in arrival volumes, particularly when services accommodate the operating hours and event schedules typical of these venues. Continued monitoring of 2026 openings will provide additional evidence on how these infrastructure changes sustain or alter long-term attendance trends at affected locations.